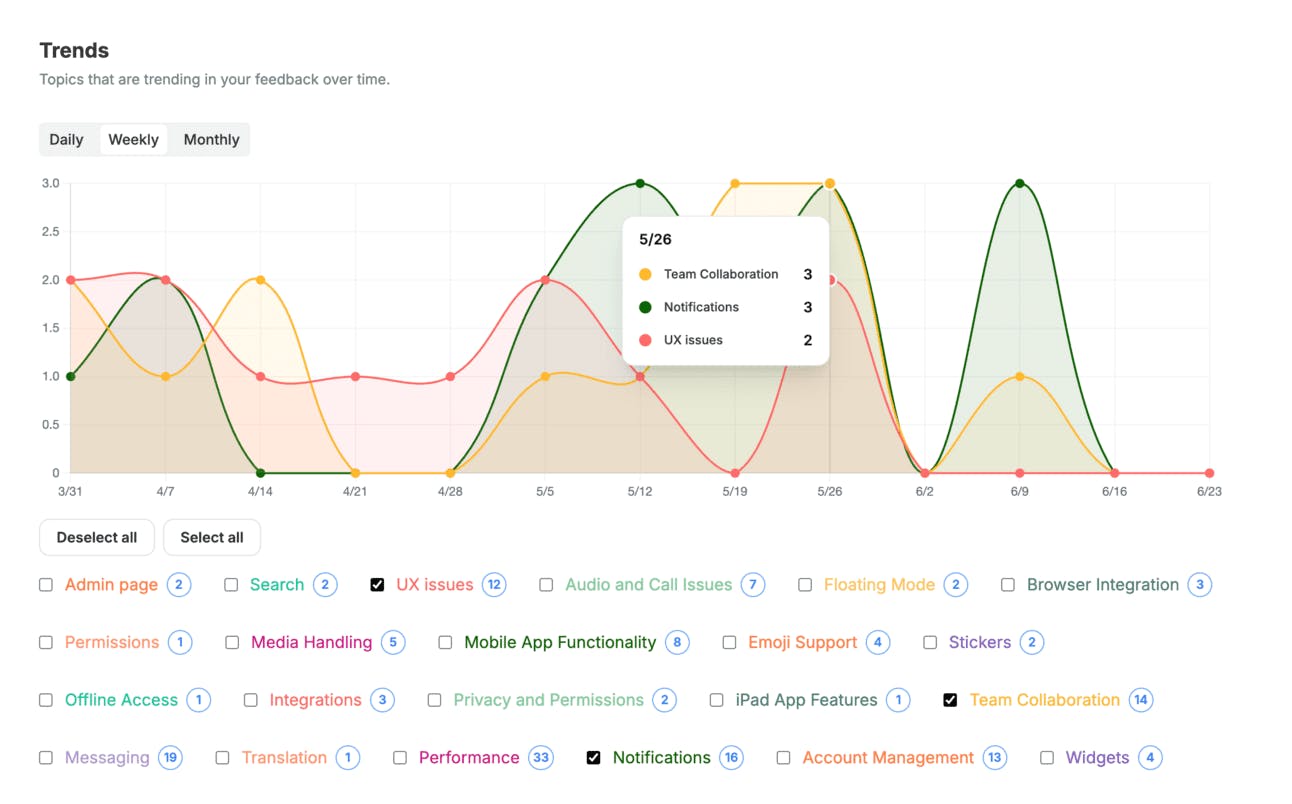
CSV cells are now plotted on the chart based on date: When you upload a CSV file, just map a date column, and your feedback will show up on the Trends chart exactly like feedback from our integrations.
💡 Learn what users need from calls, reviews, other feedback
💬 Collect new feedback with AI interviews & surveys
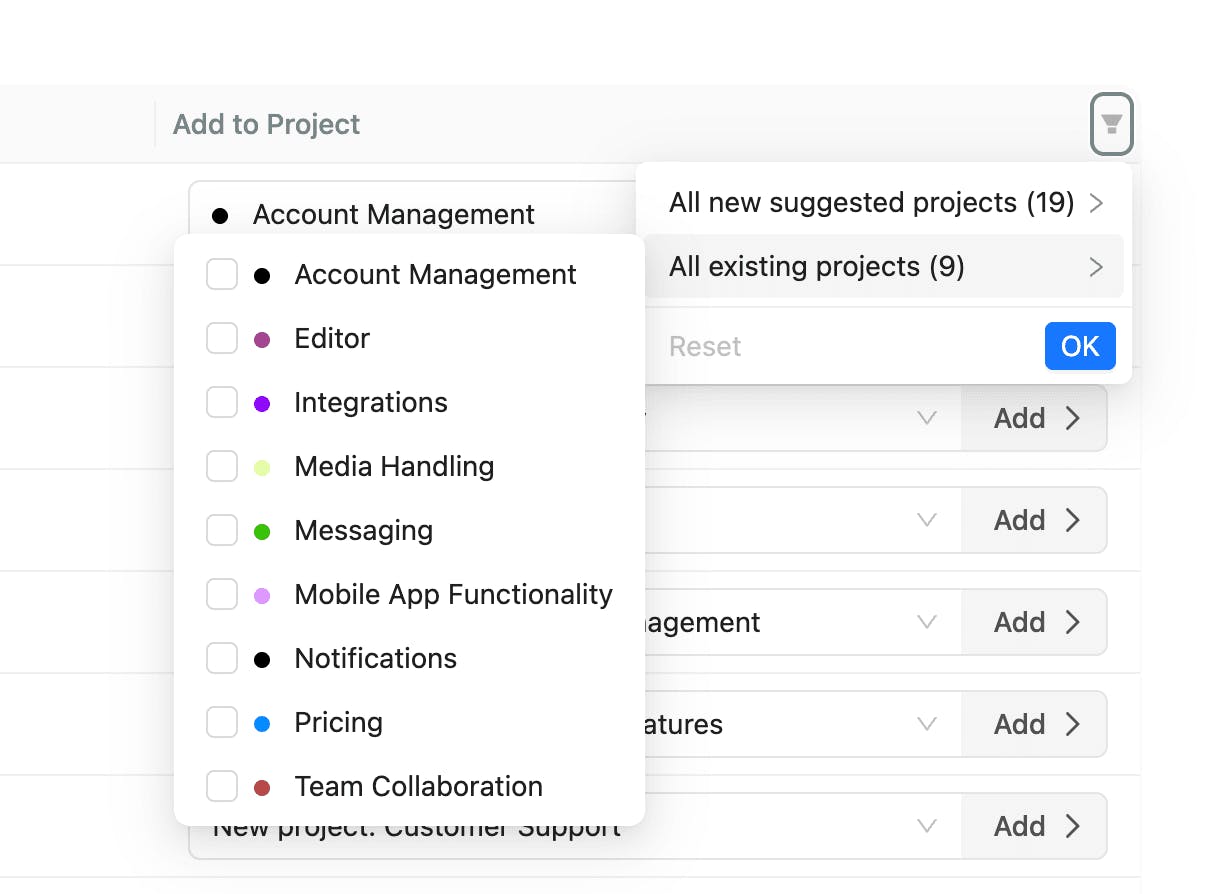
👩🏻💻 Plan your product with AI sorted projects
📄 Strategize with AI written PRDs based on user feedback
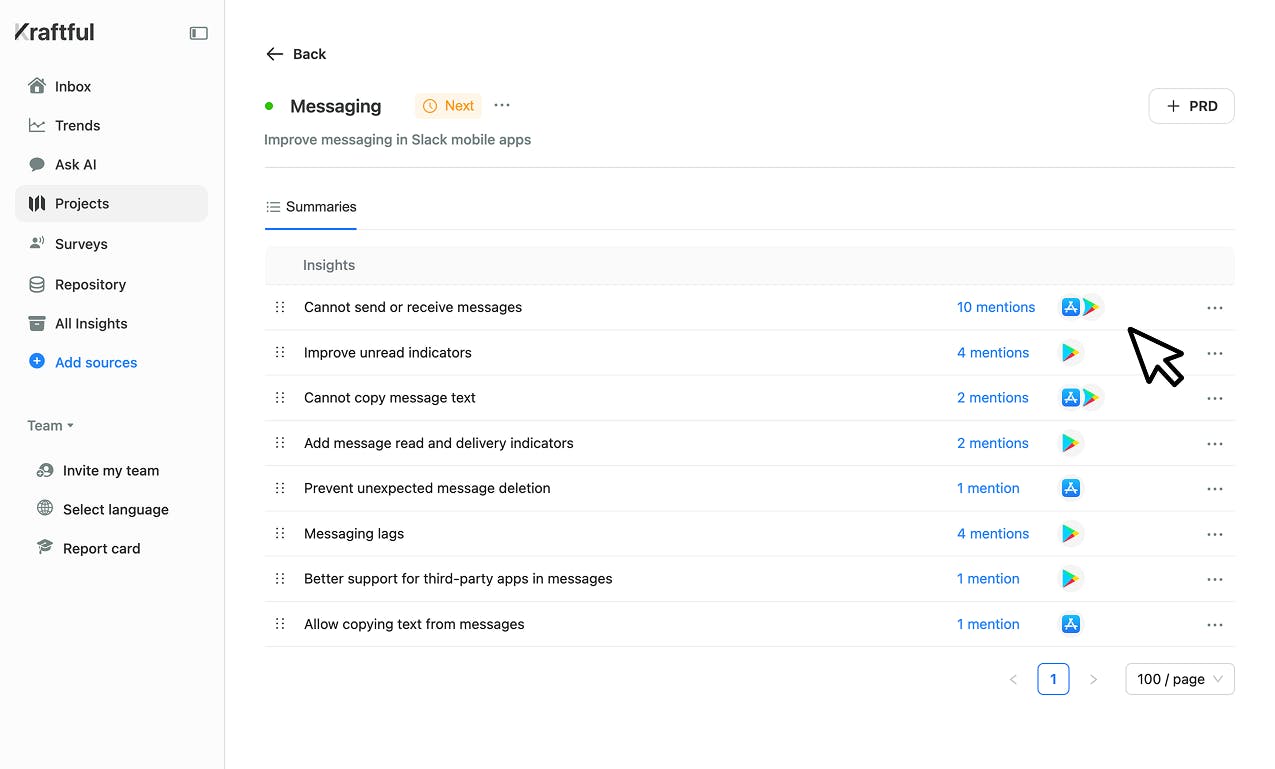
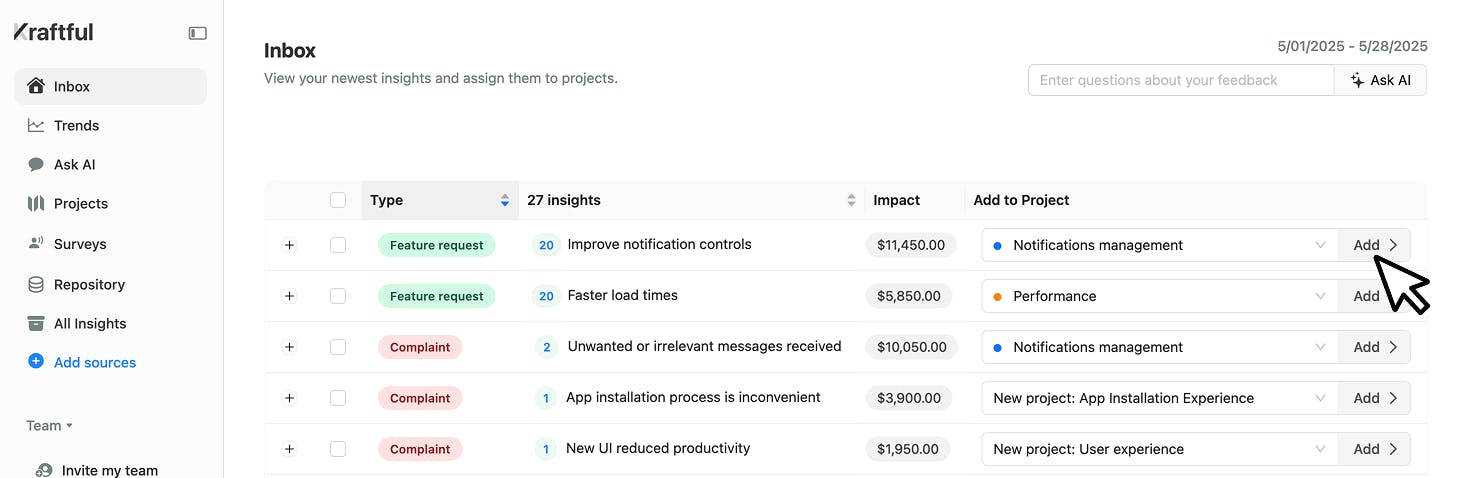
Kraftful saves product builders hundreds of hours by using AI to analyze user feedback in one place. Identify your highest priority product improvements, write JIRA tickets, and use ChatGPT to uncover deeper insights ✨
Try it out on kraftful.com