There have been different iterations of what Unubo is as a product. This time around we went back to basics by ensuring first, that we create something people actually want.
Today we start from the ground up. We begin at zero.
Over the years working on several projects, I always found it cumbersome to log into different tools to check for metrics:
💰 Stripe for revenue information.
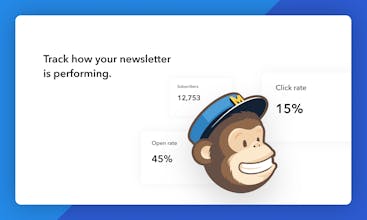
🗞 Mailchimp to check on the latest campaign numbers.
📈 Mixpanel or Google Analytics for traffic.
🐦 Twitter isn’t for metrics as such, but it’s important to see if you’ve been mentioned.
Getting a complete picture on how I was progressing involved me logging into all relevant apps manually, get the latest numbers, then put them onto a slide, Google Sheet, shared doc, or similar.
Not particularly elegant so I always thought: “Isn’t there something that does this automatically?”
Through speaking with founders I discovered that many of you work the same way, doing things like this manually.
The current solutions, whether it’s a business intelligence, data visualisation, or general dashboard tool all follow the same approach. You choose from 100s of data sources, and are then forced to build a dashboard. Yes, build one.
Once you get over that, they usually come with a learning curve, and are out of reach price wise for many small to medium businesses, whereas the cheaper solutions just don’t do enough.
We take a different approach, focused on simplicity.
Unubo uses data from tools you use on a daily basis, then automatically presents it in a way that makes it easier for you to track progress across different areas of your startup.
Rather than the word “dashboard” we say “view”. A dashboard tries to show you many things at once, whereas views are designed to offer you simply designed, quick glances at the metrics that matter. Think of views thoughtfully curated alternatives to dashboards.
Today we launch with 4 views:
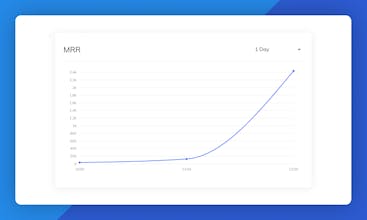
💰 Growth: Track how you’re growing.
🗞 Newsletter: Track how your newsletter is performing.
🐦 Social: See if you’ve been mentioned on Twitter.
📈 Traffic: Track website traffic.
This is just the beginning. Over time we’ll add more views, meaning more data. Unubo will learn from this data, helping you make increasingly more complex decisions about your business, where you can ask questions such as:
“Will we meet our revenue goals this quarter?”
“Can we afford 10 more engineers right now?”
That’s for future phases though. For now, we want to enable you to watch the results of your efforts compound over time, and focus on building products, not dashboards.
@leandro8209 Quick question: can we only plug in the tools you displayed (e.g. only Mailchimp for newsletters) or do you also communicate with other tools?
@leandro8209@clo__s Yes, for now it's only those tools. On the backend we're setup in a way that it's quite simple to add more. As people request them, we'll add!
this is fantastic! I might just stop checking and refreshing multiple tabs 🤔. I like how you reduce the noise around key product metrics and showcase the important information straight.
do you have a public roadmap? and what are the integrations coming up next?
@boristane Cheers, Boris! No public roadmap at the moment. I'm currently selecting a tool that will help with gathering feedback. We'll use that to inform us what to integrate next.


Merida for Remote Workers
Ness Labs
Merida for Remote Workers
Merida for Remote Workers
Baselime
Merida for Remote Workers
Pingman
Merida for Remote Workers