TV Charts

TV Charts

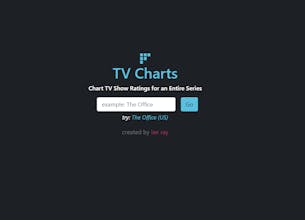
Visualise TV show ratings for an entire series

6 followers

Inspired by the creative work on reddit.com/r/dataisbeautiful, I created a website that uses IMDb data to create these charts automatically.
TV Charts gallery image
Free
Launch tags:
TV
Launch Team

What do you think? …

Gabe O'Leary
This is super cool! The Simpsons is a great example of how a show changes over time, it might be cool to include some other examples on the home page (with a screenshot of their results). I love that you've included a toggle to make it easier to use for color blind people. A couple of other suggestions: - the best/worst text on the left hand side is a little hard to read, especially as you get in to purple on black - it took a while for me to figure out which axis was season vs episode. Labels would be helpful.
Benjamin Mizrahi
Nice job! It's a good complement to https://tvchart.benmiz.com ;)
ian ray
@jaja321 I was inspired by the charts from Reddit, but your site was a great inspiration for minimalist UI. Thanks!
Jayden Carey
Hey @ianthekid I absolutely love this! One suggestion I have would be to actually have an incremental colour scale, rather than just the few colour ranges you've grouped it by. I've actually created a very hacky userscript to show what I mean: https://greasyfork.org/en/script... Also screenshot: