Product Hunt logo dark
  • Launches
    Coming soon
    Upcoming launches to watch
    Launch archive
    Most-loved launches by the community
    Launch Guide
    Checklists and pro tips for launching
  • Products
  • News
    Newsletter
    The best of Product Hunt, every day
    Stories
    Tech news, interviews, and tips from makers
    Changelog
    New Product Hunt features and releases
  • Forums
    Forums
    Ask questions, find support, and connect
    Streaks
    The most active community members
    Events
    Meet others online and in-person
  • Advertise
Subscribe
Sign in
Subscribe
Sign in
Polar Signals Cloud

Polar Signals Cloud

Debug Daily. Optimize Always.

66 followers

Debug Daily. Optimize Always.

66 followers

Visit website
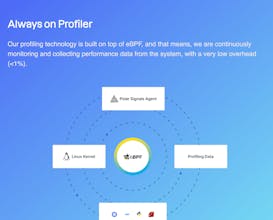
Discover opportunities to improve performance, reduce time to resolution, and lower infrastructure costs through Polar Signals Cloud.
  • Overview
  • Launches1
  • Reviews
  • Alternatives
  • Team
  • More
Company Info
polarsignals.com
Polar Signals Cloud Info
Launched in 2023View 1 launch
Forum
p/polar-signals-cloud
  • Blog
  • •
  • Newsletter
  • •
  • Questions
  • •
  • Forums
  • •
  • Product Categories
  • •
  • Apps
  • •
  • About
  • •
  • FAQ
  • •
  • Terms
  • •
  • Privacy and Cookies
  • •
  • X.com
  • •
  • Facebook
  • •
  • Instagram
  • •
  • LinkedIn
  • •
  • YouTube
  • •
  • Advertise
© 2025 Product Hunt

Similar Products

Debug Mail
Easy-to-use mail server for developers
4.0(3 reviews)
Visual Debug
A Visual feedback tool for better client-dev communication
5.0(6 reviews)
Polar Signals Cloud gallery image
Free Options
Launch tags:
Developer Tools
Launch Team
Kevin William DavidFrederic Branczyk

What do you think? …

Frederic Branczyk
Frederic Branczyk
Polar Signals Cloud

Polar Signals Cloud

Maker
📌
Hello Product Hunt! Myself and several members of the Polar Signals team have been long time Observability ecosystem maintainers of projects such as Prometheus, Thanos, Cortex, Kubernetes and many more. In 2018 we read the "Google-Wide Profiling" paper and immediately realized we have to treat profiling just like any other Observability data, by systematically and comprehensively collecting it for our entire infrastructure and applications and store that throughout time. At the same time eBPF was on the rise and it was a match made in heaven, we can provide an incredible user experience without requiring any code changes, and all our users need to do is deploy an agent (a single command to run against a Kubernetes cluster), and we can profile just about any popular language (and those that we can't profile yet we have on the roadmap). Not only does eBPF get us an incredible user experience, it also allows us to collect this data at never-before-seen low overhead (<1%) since we can grab exactly the data we need and nothing more. In addition to that we built a custom columnar database to back this product to allow a Prometheus-style label-based query language to work on this very high cardinality data. In a world where the economics of Moore's Law have already stagnated, everyone is going to have to learn to build more efficient software, and the root of all evil performance optimizations are those that are not based on measurements. We're going to be hanging out in the comments all day, so please feel free to ask us any questions you might have, as well as any feedback you have for us!
Report
2yr ago
Tornike Tsiramua
Tornike Tsiramua
@brancz Hi Frederic, Thank you for the cool product. Well done on the successful launch!
Report
2yr ago
Narendra Solanki
Narendra Solanki
Middleware

Middleware

Congratulations on bringing this to the market! 🎉 How does it compare with other similar tools in terms of accuracy and efficiency?
Report
2yr ago
Frederic Branczyk
Frederic Branczyk
Polar Signals Cloud

Polar Signals Cloud

Maker
@narendra_solanki Great question! So first of all, I think they all have their trade offs, and while I of course think we chose the "right" tradeoff, I think arguments can be made for and against any of them (a good one was that our approach was significantly more difficult to build and so it took longer). I'll focus on Pyroscope and DataDog as they come up most often, but if you have others that you'd be interested to hear our thoughts on let me know! * Pyroscope: The only other one that is built on open-source. Pyroscope very quickly gets rid of dimensions, data gets merged and raw resolution is lost quickly, and some detail is never even produced. This makes storing data cheap, but it also prevents you from accessing raw resolution. Additionally it doesn't store file and line number metadata. This prevents some more advanced features from being possible like our source viewer[1] feature or the ability to use the data for profile-guided optimizations[2]. Pyroscope also doesn't have a real comparison view, you can only view two queries side by side instead of one visual report that shows the difference using colors. * DataDog: Perhaps unsurprising, DataDogs pricing is a reason why some of our customers turned to us. With DataDog it's $40 per host per month, whereas we charge on the amount of bytes sent. DataDog also doesn't allow viewing raw data. Pyroscope and DataDog also focused much more on instrumented profiling, where you have to add a library and potentially do custom instrumentation to get data, whereas we've focused almost entirely on only collecting data without any code or deployment changes (what we call "zero-instrumentation") via eBPF. This allows users to get much deeper insight (down into Kernel stacks) and across the entire infrastructure even into pieces that you may not control (it has happened countless times that our customers discovered slow behavior in Kubernetes, containerd, postgres, mysql, or other pieces of software that they happen to interact with but can't instrument themselves). Using eBPF allows us to gather this data at extremely low overhead (<1%; and most customers can't distinguish it from CPU noise). Last but not least, we've focused a lot on building a Prometheus-style query experience where users can define arbitrary labels to be attached to profiling data so you can make the tool your own instead of the tool forcing you into some scheme. This means you can compare version X with version Y of your software, or node A with node B or AWS region us-east-1 with us-west-1. The other tools in the space either can't do this at all or are much more restricted in what you can do. [1] https://www.polarsignals.com/blo... [2] https://github.com/golang/go/wik...
Report
2yr ago
Narendra Solanki
Narendra Solanki
Middleware

Middleware

@brancz Thank you for such a comprehensive breakdown! Your emphasis on a 'zero-instrumentation' approach using eBPF and the flexibility of a Prometheus-style query experience is particularly impressive. It's evident that your tool is carved out with a vision to deliver deeper insights without compromising on efficiency. The flexibility to define arbitrary labels sounds incredibly useful for customised data analysis. I appreciate the clarity and the passion with which you're driving the project. I'm excited to see how it evolves further. Keep up the excellent work! 👏🌟
Report
2yr ago
stan
stan
Excellent platform for managing cloud infrastructure. Results were quicker than expected - saved time and costs. Highly recommend!
Report
2yr ago
LaunchDarkly
LaunchDarkly — Helps devs ship faster and safer with feature flags
Helps devs ship faster and safer with feature flags
Promoted

Do you use Polar Signals Cloud?

Reviews
Helpful
Review Polar Signals Cloud?Be the first to review Polar Signals Cloud